 |
Could Betty Have Heard Amelia Earhart on a Harmonic?
This paper presents the results of additional research since the author’s earlier paper,1 as part of TIGHAR’s continuing assessment of Betty’s report that she heard signals from Amelia Earhart in July 1937, while listening to her father’s shortwave radio at St. Petersburg, Florida.
The principal conclusion of the analysis, as in the previous paper, is that Betty could have heard signals from Amelia at Gardner Island on a harmonic frequency generated by her Western Electric WE-13C transmitter. That conclusion has been strengthened by: use of improved computer simulation software; further analysis of the WE-13C final power amplifier design; application of Fourier analysis to estimate the WE-13C power output at harmonic frequencies; and collateral information acquired since the previous paper was written.
The analysis continues to stand on the foundation of the team effort reported previously, in which TIGHAR Executive Director Ric Gillespie served as the project point of contact with Betty; Mike Everette, TIGHAR #2194, provided crucial insights2 on the design of the WE-13C transmitter; and Harry Poole, TIGHAR #2300, researched property records in St. Petersburg, and took photographs and measurements of Betty’s former house and adjoining property, enabling derivation of Betty’s receiver antenna configuration.
As noted in the previous paper, initial analysis when Betty’s report was received showed that she could not have heard Amelia on 3105 kHz (her night frequency) or 6210 kHz (her day frequency) because the entire propagation path from Gardner Island to St. Petersburg was in daylight, and the path loss was too high for reception on either frequency. But since Betty’s notebook was too credible to be dismissed out of hand, it was decided to consider alternative explanations, which led to Everette and the author independently recognizing the possibility that Betty could have heard Amelia on a harmonic of 3105 kHz or 6210 kHz.
The WE-13C schematic3 shows that the transmitter’s final power amplifier output was connected directly to the antenna without harmonic suppression filters.4 This allowed harmonic current components in the transmitter output to flow in the antenna, producing harmonic radiation. The central question is whether such radiation from Amelia’s transmitter at Gardner Island could have produced the signals that Betty heard.
The value of the WE-13C final power amplifier design parameter governing the harmonic spectrum content in the output of that stage was derived5 by applying engineering design principles in use circa 1935, when the transmitter was designed. The resultant parameter value was used with Fourier analysis to calculate the WE-13C power output6 at harmonics of Amelia’s frequencies, shown in Table 1.
Computer simulation was used to model the signal strength radiated from Amelia’s antenna, given the WE-13C power outputs at harmonic frequencies; to model the propagation conditions for the path from Gardner Island to St. Petersburg, at the harmonic frequencies; and to compute the signal-to-noise ratio (SNR) statistics at the input of Betty’s receiver. Probabilities of reception were computed from the SNR statistics. Betty heard signals from 4:30 PM to 6:15 PM local time, but did not recall the date on which she heard the signals. So, computer simulation runs were conducted for the time period of interest on each day from July 2nd through July 9th, 1937.
Collateral information acquired since the previous paper was used in the analysis.
ICEPAC7 was used to model propagation conditions and to compute the SNR statistics.
4NEC28 was used to model Amelia’s transmitter antenna, using more precise dimension details from photographs of the Electra cabin interior, in the TIGHAR library. 4NEC2 is a recent Windows XP implementation integrating NEC2 – the widely respected Numerical Electromagnetics Code (version 2)9 – with a full-featured 3-dimensional graphical user interface (GUI) that greatly improves both simulation setup and analysis of results. 4NEC2 also generates 3-dimensional antenna gain pattern tables for use in ICEPAC.
The gain patterns of Amelia’s antenna and Betty’s antenna used in the previous analysis were computed with NEC4WIN95.10 The gain patterns of Amelia’s antenna were recomputed with 4NEC2 for this update because of NEC2’s better capability to model antennas close to ground. The previously computed gain patterns of Betty’s antenna were retained for this update because the antenna was high enough that ground proximity was not an issue.
The antenna resonated at frequencies across a broad range when the transmitter was operating on either channel frequency (Fo), 3105 kHz or 6210 kHz. The resonant frequencies were found with 4NEC2 by adjusting the antenna loading coil inductance in accordance with the WE-13C tuning procedure in Morgan11 to achieve resonance at Fo, and then sweeping through frequencies to find the resonant frequency nearest each harmonic up to 5 x Fo. Higher order harmonics were not considered because the WE-13C output power above the 5th harmonic was negligible. The antenna radiation efficiency, reported by 4NEC2 for Fo and each of its harmonics, was used with the antenna power input12 to obtain the radiated power. The results are shown in Table 1.
Table 1. Earhart’s Antenna Performance
Frequency (kHz) |
Nearest Resonance (kHz) |
Freq Difference (%) |
Radiation efficiency (%) |
Power Input (watts) |
Power Radiated (watts) |
3105 |
3105 |
0 |
17.6 |
50 |
8.82 |
6210 |
9880 |
59.1 |
35.2 |
33.96 |
11.98 |
9315
| 9880 |
6.1 |
20.5 |
15.88 |
3.25 |
12420
| 9880 |
25.7 |
53.4 |
2.84 |
1.52 |
15525
| 18280 |
17.7 |
73.2 |
2.47 |
1.81 |
6210
|
6210 |
0 |
35.29 |
50 |
17.65 |
12420 |
10735 |
15.7 |
55.27 |
33.96 |
18.76 |
18630 |
19350 |
3.8 |
87.62 |
15.88 |
13.91 |
24840 |
25085 |
1.0 |
83.09 |
2.84 |
2.36 |
31050 |
33590 |
8.2 |
87.54 |
2.47 |
2.16 |
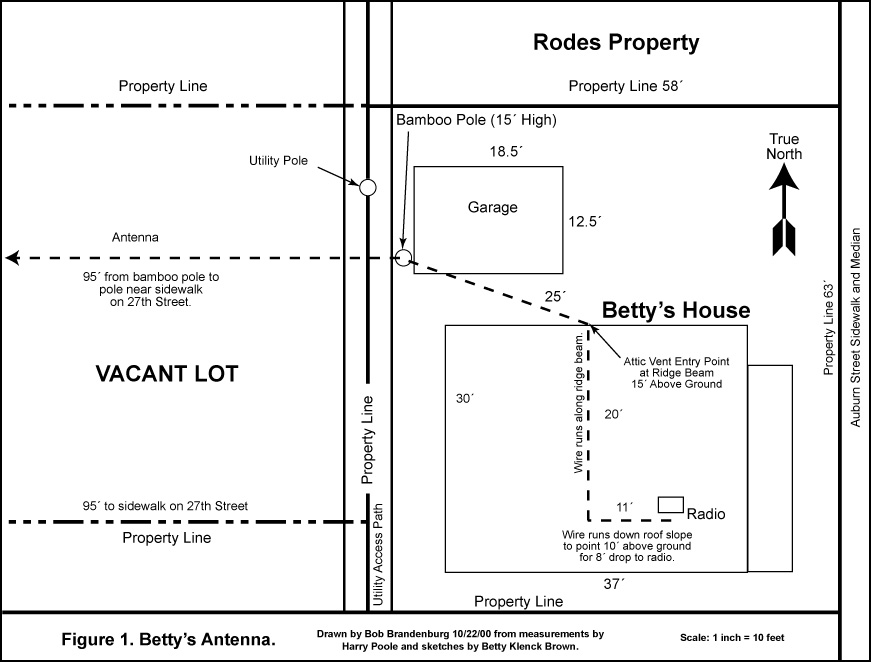 The
configuration of Betty’s antenna is shown in this sketch; click on the image
to open a larger version in a new window.
The
configuration of Betty’s antenna is shown in this sketch; click on the image
to open a larger version in a new window.
The antenna gain pattern had a broad lobe in the direction of Gardner Island, with a gain of 2 to 3 dB at frequencies above 12240 kHz.
Betty’s Radio
It was important to know the make and model of Betty’s radio, because receiver sensitivity and tuning range are important factors in evaluating whether she could have heard signals from Gardner Island. Betty did not recall the make and model of her radio, but she provided information that enabled research leading to a determination that it probably was a Zenith console radio model 1000Z “Stratosphere.”13 When shown a photograph of a Zenith 1000Z, Betty positively identified that radio as the same model she had used.
The model 1000Z was sold by Zenith during 1935–1938, and was a very capable radio with extensive shortwave band coverage. Approximately 350 sets were produced.14 The first 100 production units had shortwave coverage up to 63.6 MHz, and the follow-on units had coverage up to 45.0 MHz. The 1000Z had 2 tuned radio frequency amplifier stages and 2 intermediate frequency amplifier stages. It also had a variable bandwidth, user-adjustable to a maximum of 6 kHz.15 This analysis assumes that the bandwidth of Betty’s receiver was set at 6 kHz.
Signal-to-Noise Ratio (SNR) Considerations
International Telecommunications Union (ITU) Recommendation F.339-6 specifies the SNR values required for various grades of service. The lowest acceptable grade of service for a voice signal of the kind emitted by the WE-13C is 90 percent understandability of sentences, which requires a 6 decibel (dB) audio SNR at the receiver output. F.339-6 specifies an input SNR of 51 dB in a 1 Hertz band as needed to produce the required output SNR in a receiver with a 6 kHz bandwidth in fading conditions, with non-diversity reception – i.e., using a single antenna.
However, the F.339-6 results assume white Gaussian noise.16 Spaulding17 presented results showing that a given voice understandability can be achieved with a 6 dB lower SNR if the input noise is impulsive. This would reduce the required input SNR to 45 dB in a 1 Hertz band, implying that a 39 dB input SNR would produce a 0 dB audio output SNR.
Receiver input noise is a combination of three types of noise – galactic, man-made, and atmospheric – the characteristics of which are discussed in ITU Recommendation P.372-8, “Radio Noise.” Galactic noise is negligible at the frequencies of interest in this analysis. Manmade noise, produced by electrical equipment, is impulsive. Atmospheric noise, which also is impulsive, is produced by lightning discharges and can propagate very long distances via the ionosphere. This analysis assumes that the noise interfering with the signals Betty heard was impulsive, and that the 6 dB SNR reduction reported by Spaulding is applicable.
Betty said the signals she heard were “scratchy,” breaking in through static and fading out, and that she couldn’t always make out complete phrases. This description is consistent with signal quality intermediate between the 90% understandability level corresponding to a 45 dB receiver input SNR, and the zero understandability level corresponding to a 39 dB input SNR. Accordingly, this analysis uses 43 dB as the required SNR threshold for signal reception.
The Probability of Achieving the Required SNR
SNR is a random variable. When expressed in decibels, its random behavior is described by the Normal probability density function, the familiar “bell curve.” In an ideal situation, the mean SNR would be well above the reception threshold, and random variations about the mean would not be noticed. But in a marginal situation such as described by Betty, the mean is below the reception threshold, and random variations occasionally raise the SNR above the threshold, permitting some words and phrases to be recognized.
ICEPAC reports the mean and 90th percentile values of SNR, which were used externally to calculate the probability of the SNR exceeding the required threshold.
Selecting Harmonic Frequencies for Consideration
Ideally, Betty would have recorded in her notebook the frequency on which she heard the signals.
Unfortunately, such was not the case. She was “blindly” tuning the receiver, without watching the tuning dial, while sketching in her notebook and listening for interesting shortwave stations, and did not note the frequency on which she heard the signals.
Since the frequency on which Betty heard the signals is not known, and since the frequency coverage of the frequencies up to the 5th harmonic were selected for consideration.
Reception probabilities calculated from the SNR statistics reported by ICEPAC for frequencies below 18 MHz during the time period of interest from July 2nd through July 9th 1937, were less than 10-23, which was considered to be zero for the purposes of this analysis. This eliminated frequencies up to the 5th harmonic of 3105 kHz, Amelia’s night frequency.
The reception probabilities at the 3rd, 4th, and 5th harmonics of 6210 kHz –Earhart’s day frequency – showed that reception was possible,18 although the extremely poor results on 18630 kHz – the 3rd harmonic – suggest that this frequency can be eliminated from consideration.
The results at 24840 kHz and 31050 kHz, are consistent with rare events, and with Betty’s description of the signals she heard. The smaller range of variance in the mean SNR at 24840 kHz suggests that frequency was the most feasible of the two. The results for 24840 kHz are included in table PLSigStats4.pdf in Post-Loss Signals, which presents the results of ICEPAC runs and signal statistics calculations for all reported post-loss radio signals in the Master List. See also the comprehensive probability table “Probability of Betty Hearing Amelia.”
- Betty could have heard signals from Earhart at Gardner Island on 24840 kHz or 31050 kHz.
- The low and varying probabilities of achieving the required SNR on 24840 kHz and 31050 kHz are consistent Betty’s description of the fragmented signals that she heard.
| 1 | Brandenburg, Bob, “Harmony and Power: Could Betty Have Heard Amelia Earhart on a Harmonic?,” Earhart Project Research Bulletin #30. |
| 2 | Everette, M., “The Electra’s Radios,” Earhart Project Research Paper. |
| 3 | Morgan, Howard K., Aircraft Radio and Electrical Equipment, 2nd Edition, 1941, Pitman Publishing Corporation, New York and Chicago. |
| 4 | Everette has discussed this topic on the TIGHAR Earhart Forum. |
| 5 | Brandenburg, Bob, “WE-13C Transmitter Harmonic Power Output,” Earhart Project Research Paper. |
| 6 | Ibid. |
| 7 | ICEPAC is the Ionospheric Communications Enhanced Profile Analysis and Circuit prediction program, developed by the Department of Commerce Institute for Telecommunications Science (ITS) at Boulder, Colorado. Available on the web at www.its.bldrdoc.gov. |
| 8 | Available at www.si-list.org/swindex2.html. |
| An extensive literature on NEC is available on the web. | |
| 10 | NEC4WIN95 is a widely used commercial model for interactive design and analysis of antennas. Available from Orion MicroSystems, at www.orionmicro.com. |
| Op. Cit. | |
| 12 | Brandenburg, Bob, “WE-13C Transmitter Harmonic Power Output,” Earhart Project Research Paper. |
| 13 | Photos and other information are available at www.oldradiozone.com. |
| 14 | See www.oldradiozone.com. |
| 15 | Zenith 1000Z technical data, John F. Rider, available at www.nostalgiaair.com. |
| 16 | Spaulding, A.D., and F.G. Stewart, “A Critique of the Reliability and Service Probability Calculations for the Ionospheric Communication and Prediction Program – IONCAP,” NTIA Report 93-297, U.S. Department of Commerce, National Technical Information Service, August 1993. |
| 17 | Spaulding, A.D., “Atmospheric Noise and its Effects on Telecommunication Systems”, Chapter 6, Handbook of Atmospherics, ed. H. Vollard, CRC press, Boca Raton, FL, 1982. |
| 18 | See “Probability Table.” |